
The Spheria Global Opportunities Fund returned +1.8% (after fees) during the month of March, underperforming the MSCI World Small Cap Index by 1.8%.
Performance
1 Spheria Global Opportunities Fund. Returns of the Fund are net of applicable fees, costs and taxes.
2 Benchmark is MSCI World Small Cap Index (net in AUD) for all periods. Please note that the Benchmark from inception to 30 June 2021 was the MSCI Kokusai Microcap Index (net in AUD) and from 1 July 2021 to 30 September 2022 was the MSCI World Microcap Index (net in AUD).
3 Inception date is 1 March 2019. Past performance is not a reliable indicator of future performance. All p.a. returns are annualised.
Please note the strategy of the Fund changed effective 1 October 2022. The Spheria Global Opportunities Fund was previously known as the Spheria Global Microcap Fund which targeted global listed microcap companies (companies with a market capitalisation of US$1 billion and below at time of purchase).
Overall Commentary
Top 5 Holdings
Regional Exposure
Source: Spheria Asset Management
Sector Exposure
Markets
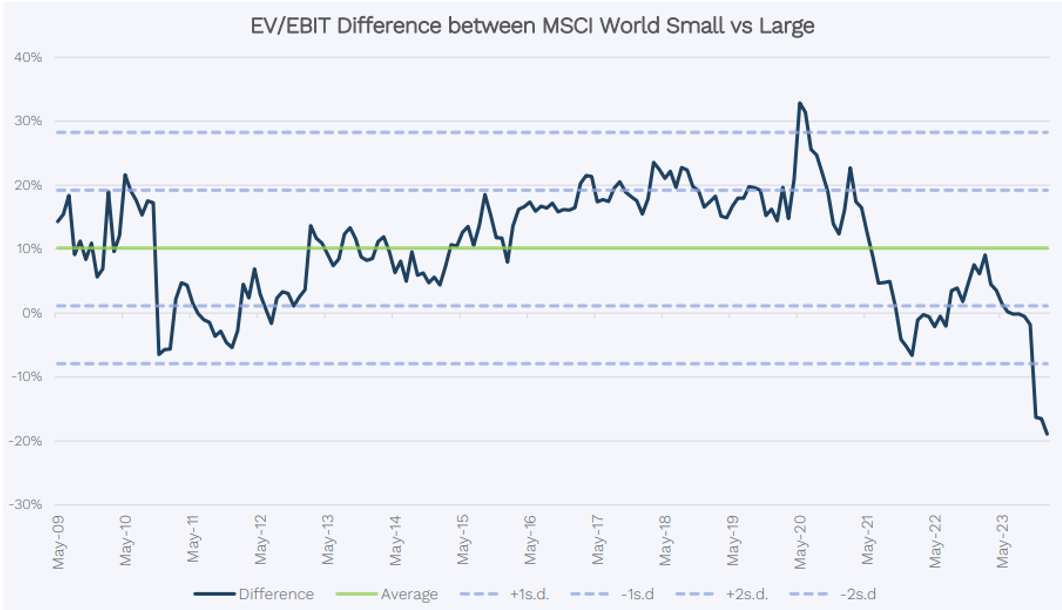
The benchmark has now risen an impressive 25% from the October 2023 lows. The underlying drivers for the rally are broadly consistent with previous months. Namely the now broad consensus that interest rates have peaked, sustained enthusiasm related to artificial intelligence, and a general boost in speculative fervor reflected clearly in the 110% bounce in Bitcoin since the equity market’s October lows.
Small cap equities have kept pace with their large cap brethren over this period but are yet to meaningfully close the unprecedented valuation gap that’s opened since the Covid-19 pandemic.
Looking at the strongest performers in the index over the month provides a clear gauge of market sentiment. Five of the top 10 performers were biotechnology companies, four of which are loss-making and cash burning. Of the remaining five companies, four are unprofitable or borderline profitable at best. Among this group is a bitcoin miner, a fast-food chain, and two software businesses with highly geared balance sheets (rarely a good idea when you’re unprofitable). The remaining business, Spirent Communications (SPT LN), is a testing and assurance business in the telecommunications industry. This looks to us like a reasonable business, albeit one that hasn’t grown revenue for a decade, making the bid price (86% premium to last and 25x EBIT) look somewhat generous… the Spirent directors wisely didn’t hesitate to recommend the bid to their shareholders.
The market’s willingness to support frothy M&A activity, cash burning and debt ladened businesses, alongside the surge in the market value of cryptocurrency, is broadly symptomatic of the speculative mood that’s taken hold in markets.
Major contributors to performance
Over the month the largest contributors to performance were from overweight positions in Vista Group International (VGL.NZ, +22%), Intertek Group (ITRK.LN, +8%), and Thule (THULE.SS, +11%).
Vista Group International (VGL.NZ) is the largest provider of ERP software (financial systems) to the Cinema market globally with a market share above 50% outside of China. As detailed in previous monthlies, VGL is well underway now in its transition from on premise software to a SAAS style business model, with a potential uplift in revenue per customer in the order of 3-5x. The VGL share price rose 20% in March post the announcement of its full year result at the end of February. Recurring revenue and SaaS revenue grew 10% and 20%, respectively, whilst EBITDA grew 25% although the company continues to capitalise an elevated level of R&D in respect of its cloud transformation. The cloud rollout continues to gather momentum with its first multi-territory client live and several new signings representing ~350 sites out of the group’s approximate 7,800 sites. The business also reaffirmed medium term aspirations of ‘Annualised Recurring Revenue’ (ARR) of $175m and an EBITDA margin of 15%+ by the end of CY25, and to be free cash flow positive in Q424. We have been a long-term shareholder of Vista, attracted to its strong market share (>50% ex-China) and transition from on premise to cloud revenue model, which will increase their share of wallet and drive significant growth in revenue and earnings.
Intertek Group (ITRK.LN) is a Total Quality Assurance provider to a range of industries worldwide. The global testing, inspection and certification (TIC) market is worth more than USD $200bn p.a. and is expected to grow at 6% pa to over USD $300bn by 2030. Intertek is a major player in the global TIC industry, generating revenue of £3.3bn in CY23. The business is well positioned to benefit from the structural growth of the industry and has significant barriers to entry. ITRK has been a core holding in the fund for almost a year and recently released its CY23 full year results, demonstrating strong performance after recording its highest LFL revenue growth in a decade, 60bps of operating margin improvement and excellent cash conversion, seeing gearing fall below 0.8x ND/EBITDA. Trading on an undemanding EV/EBIT multiple of 15x, we are attracted to the business’s solid market position as the structural growth in compliance and sustainability standards drives demand for Intertek’s services. Intertek has a track record of generating stellar free cash flows and has outpaced its EU peer set in terms of organic growth in recent years, whilst also having a more diverse book of business (both at the geographic and industry level) which helps to smooth its earnings profile.
Major detractors from performance
Over the month the largest detractors to performance were from overweight positions in Zillow (Z.US, -13%), YouGov (YOU.LN, -13%) and Napco (NSSC.US, -11%).
Zillow (Z.US) underperformed after the National Association of Realtors (NAR) announced a US$418m settlement with a group of plaintiffs (home sellers) who claimed that the association’s policies on commissions artificially inflate costs. The terms of the settlement, sensibly in our view, are designed to promote a more transparent and negotiated commission structure between buyers and buyer’s agents. Whilst this may negatively impact the aggregate size of the agent commission pool (from which Zillow’s earns its revenue), the most likely outcome in our view is little to no impact on Zillow. Notably 13 states have operated for a few years under a model similar to what’s proposed under the settlement, with no observable impact on Zillow’s revenue. Indeed, fewer dollars to go around for buyer’s
agents could actually make Zillow more valuable for the most productive agents, driving up the price of leads. Longer-term, there is some prospect that these changes ultimately pave the way for US to move from a ‘lead-gen’ to a ‘paid inclusion’ model like the one that we see in Australia, with the role of aggregating buyers shifting from the buyers agents to Zillow, in turn allowing Zillow to capture more of the economics. Whilst not our base case and the following analysis is admittedly crude, on a market capitalization per capita basis, Zillow would be worth 26x more than the current share price were it to be valued like REA Group (REA.AX).
YouGov (YOU.LN) YouGov reported half year earnings in the period. The business continued to perform well, delivering 2% organic growth in a challenging macro-economic environment, where sales cycles have been extended and overall advertising spend is flat. Reflecting the softer operating environment, the company has flagged some recent pricing pressure owing to competitor activity. YouGov is still digesting a significant acquisition in GFK’s Consumer Panel Business (Jan-23), which was acquired at an attractive 10x trailing EBIT. Such a deal was made possible by virtue of the fact that it was a forced divestment resulting from the merger between NielsenIQ and GFK SE in 2022/23. We continue to be attracted to the YouGov business model, with its high operating leverage flowing from the continued development and growth in customised longitudinal trackers for its clients. Unlike the industry, which is still dependent on third-party panel providers, YouGov develops proprietary datasets from its internal panel, which drives higher returns and an ability to build longitudinal dataset that more accurately map changing consumer tastes and habits over time for its clients. YouGov has a net cash balance sheet and trades on a relatively attractive 19x EBIT multiple for a highly cash generative company with strong growth prospects.
Outlook & Strategy Going Forward
So why don’t we own the kinds of cash burning, highly geared companies that make up the top 10 performers in the index for the month of March?
These companies are the antithesis of what we do at Spheria. Whilst periods of outperformance for such securities do occur from time to time, in the long run these are low odds bets that don’t pay for investors.
We believe that the value of a security is a function of the future free cash flow that it generates. Those that buy cash burning businesses presumably do so for one of two possible reasons:
Firstly, they anticipate that an inflexion point is near, and the company will go from generating losses to profits. Whilst this undoubtedly does happen, far more often than not it fails to transpire. For every Amazon (which notably lost money for 9 consecutive years before turning its first profit in 2003), there are many many more WeWorks. Spending one’s time searching for the proverbial needle in the haystack makes little sense to us in the context of an investment universe that’s so vast (~8000 companies) and rich with businesses that have observable track records of profits and cash flow.
The other possible rationale for buying a cash burning business is that you believe that there will be more buyers for it at a higher price in the future (irrespective of profitability). This may otherwise be referred to as the “greater fool theory”. We would never claim that one can’t profit from such an approach. But on what basis can a consistent and repeatable edge be obtained? What analysis would lead you to conclude that a business that’s unlikely to generate profits will be deemed even more valuable to future buyers than it is today? The ‘quality’ of the story? The slickness of the management team? How would you go about measuring these things? How can you be certain that you aren’t the greatest fool?
Focusing on businesses with observable track records of generating cash flow and with sound balance sheets tilts the long-term odds in our investors’ favour and may just be the closest thing to a free lunch that’s available in the global small cap market.
Platform Availability List
The Spheria Global Opportunities Fund is available on the below Platforms. Please check with your platform for minimum investment requirements and fees.
Asgard
BT Panorama
CFS FirstWrap / Edge
HUB24
Macquarie Wrap
Netwealth (IDPS Only)
Praemium
| Spheria Global Opportunities Fund | value |
|---|---|
| Benchmark | MSCI World Small Cap Index |
| Investment Objective | Outperform the MSCI World Small Cap Index in AUD (Net) over the long term |
| Investing Universe | Global listed small cap and microcap companies with a market capitalisation equal to or lower than the market capitalisation of the largest issuer in the MSCI Global Small Cap Index at the time of purchase |
| Holdings | Generally 30-80 stocks |
| Distributions | Annually |
| Fees | 1.10% p.a. management fee & 20% performance fee of the Fund’s excess return versus its benchmark, net of the management fee |
| Cash | Up to 20% cash |
| Expected Turnover | 20% - 40% |
| Style | Long only |
| APIR | WHT6704AU |
| Minimum Initial Investment | $25,000 |
Fund Ratings
Further Information
For more information, please contact Pinnacle Investment Management Limited
on 1300 010 311 or email distribution@pinnacleinvestment.com
Disclaimer
This communication is prepared by Spheria Asset Management Pty Limited (‘Spheria’) (ABN 42 611 081 326, Corporate Authorised Representative No. 1240979) as the investment manager of the Spheria Global Microcap Fund (ARSN 627 330 287) (the ‘Fund’). Pinnacle Fund Services Limited (‘PFSL’) (ABN 29 082 494 362, AFSL 238371) is the product issuer of the Funds. PFSL is not licensed to provide financial product advice. PFSL is a wholly-owned subsidiary of the Pinnacle Investment Management Group Limited (‘Pinnacle’) (ABN 22 100 325 184). The Product Disclosure Statement (‘PDS’) and Target Market Determination (‘TMD’) of the Fund are available via the links below. Any potential investor should consider the PDS and TMD before deciding whether to acquire, or continue to hold units in, the Fund.
Link to the Product Disclosure Statement
Link to the Target Market Determination
For historic TMD’s please contact Pinnacle client service Phone 1300 010 311 or Email service@pinnacleinvestment.com
This communication is for general information only. It is not intended as a securities recommendation or statement of opinion intended to influence a person or persons in making a decision in relation to investment. It has been prepared without taking account of any person’s objectives, financial situation or needs. Any persons relying on this information should obtain professional advice before doing so. Past performance is for illustrative purposes only and is not indicative of future performance. Unless otherwise specified, all amounts are in Australian Dollars (AUD).
Whilst Spheria, PFSL and Pinnacle believe the information contained in this communication is reliable, no warranty is given as to its accuracy, reliability or completeness and persons relying on this information do so at their own risk. Subject to any liability which cannot be excluded under the relevant laws, Spheria, PFSL and Pinnacle disclaim all liability to any person relying on the information contained in this communication in respect of any loss or damage (including consequential loss or damage), however caused, which may be suffered or arise directly or indirectly in respect of such information. This disclaimer extends to any entity that may distribute this communication.
Any opinions and forecasts reflect the judgment and assumptions of Spheria and its representatives on the basis of information available as at the date of publication and may later change without notice. Any projections contained in this presentation are estimates only and may not be realised in the future. Unauthorised use, copying, distribution, replication, posting, transmitting, publication, display, or reproduction in whole or in part of the information contained in this communication is prohibited without obtaining prior written permission from Spheria. Pinnacle and its associates may have interests in financial products and may receive fees from companies referred to during this communication.
This may contain the trade names or trademarks of various third parties, and if so, any such use is solely for illustrative purposes only. All product and company names are trademarks™ or registered® trademarks of their respective holders. Use of them does not imply any affiliation with, endorsement by, or association of any kind between them and Spheria.
Zenith Disclaimer: The Zenith Investment Partners (‘Zenith’) (ABN 27 103 132 672, AFSL 226872) rating (assigned Spheria Global Opportunities Fund – November 2022) referred to in this piece is limited to “General Advice” (s766B Corporations Act 2001) for Wholesale clients only. This advice has been prepared without taking into account the objectives, financial situation or needs of any individual, including target markets of financial products, where applicable, and is subject to change at any time without prior notice. It is not a specific recommendation to purchase, sell or hold the relevant product(s). Investors should seek independent financial advice before making an investment decision and should consider the appropriateness of this advice in light of their own objectives, financial situation and needs. Investors should obtain a copy of, and consider the PDS or offer document before making any decision and refer to the full Zenith Product Assessment available on the Zenith website. Past performance is not an indication of future performance. Zenith usually charges the product issuer, fund manager or related party to conduct Product Assessments. Full details regarding Zenith’s methodology, ratings definitions and regulatory compliance are available on our Product Assessments and at Fund Research Regulatory Guidelines.
Lonsec Disclaimer: The Lonsec rating (assigned as follows: Spheria Global Opportunities Fund – March 2023) presented in this document is published by Lonsec Research Pty Ltd (‘Lonsec’) (ABN 11 151 658 561, AFSL 421445). The Rating is limited to “General Advice” (as defined in the Corporations Act 2001 (Cth)) and based solely on consideration of the investment merits of the financial products. Past performance information is for illustrative purposes only and is not indicative of future performance. They are not a recommendation to purchase, sell or hold Affiliate Name products, and you should seek independent financial advice before investing in these products. The Ratings are subject to change without notice and Lonsec assumes no obligation to update the relevant documents following publication. Lonsec receives a fee from the Fund Manager for researching the products using comprehensive and objective criteria. For further information regarding Lonsec’s Ratings methodology, please refer to our website at: https://www.lonsec.com.au/investment-product-ratings/.