
The Key to Finding Small-Cap Winners Amid a King Tide
By Marcus Burns, Portfolio Manager
If a rising tide lifts all boats, then the Australian small and micro-cap market is experiencing what can only be described as the mother of all king tides.
There are several forces behind this monster tide, but monetary stimulus is the most significant.
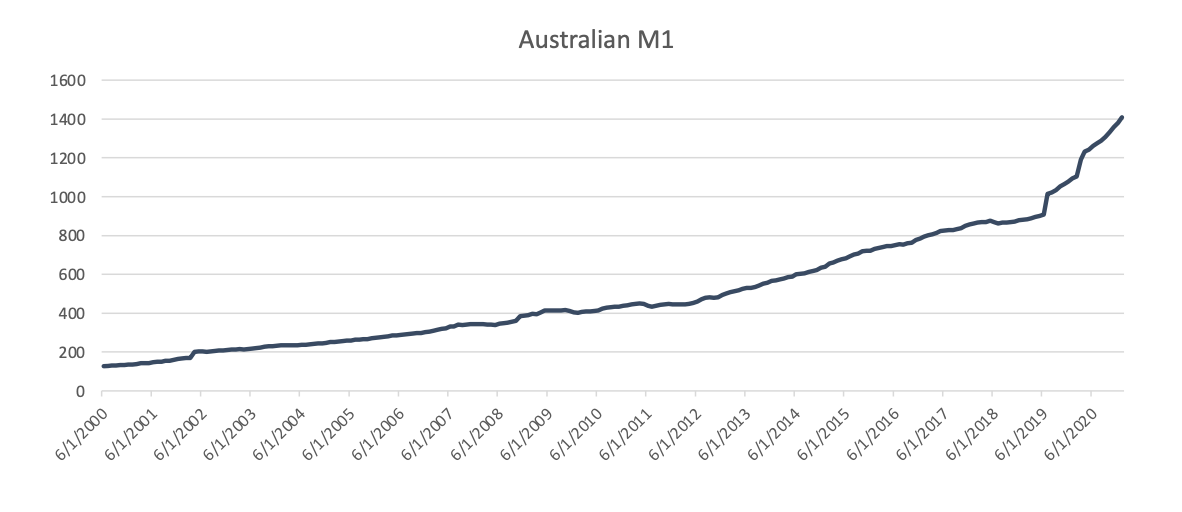
While many market commentators have discussed the large amounts of additional liquidity provided by the US Federal Reserve, the Reserve Bank of Australia has actually been increasing the supply of M1 (the measure of cash or highly liquid assets in the economy) at faster rates.
Until the onset of COVID-19, Australian M1 supply had been growing at around 12% compound since 2000, compared to 8% in the US over the same time.
Following the onset of the pandemic, M1 money supply in Australia has surged further. The RBA expanding M1 by around $320 billion or +29% year-on-year in its efforts to mitigate the economic impacts of the pandemic.
This liquidity surge has naturally resulted in a further cheapening of cash rates and falling bond yields.
 Source: Spheria, Bloomberg Data
The king tide is also being partly driven by the rise of the retail investor and passive investing.
Recently we’ve seen the incredible market impact retail investors on social networks such as Reddit have had in the US. This surge in retail investors trading on free or extremely cheap trading platforms is happening in Australia too. These are investors doing little or no fundamental analysis, but instead simply buying what’s popular.
Likewise, ballooning passive funds simply select stocks in a given sector based on their size. There’s no quality or valuation overlay.
The Stock Market Beneficiaries
Expensive concept stocks are standout examples when considering the biggest beneficiaries of this market environment. Or put another way, they’re examples of how to identify the so-called “investors” who are actually “swimming naked”.
High-multiple businesses that are often labelled “disruptors” or “next-gen tech” are floating at all-time highs. Yet many make no money.
Below we have charted the number of ASX stocks with a market cap of between $50 million and $3 billion trading on an enteprise value-to-sales (EV/sales) multiple above 10-times. To provide context, we’d typically say an EV/sales multiple of more than 5-times is expensive. So, 10-times is truly significant.
You can see in the past year there’s been a massive surge in the number of stocks on 10-times or higher.
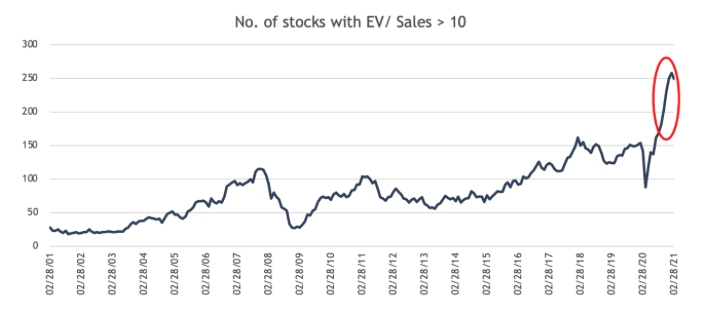 Source: Spheria, Bloomberg Data (ASX Stocks with Market Cap > $50M, <$3.0BN and EV/Trailing Sales Multiple Over 10X)
If you break this down further and look at the recent growth of operating cash flow negative companies versus operating cash flow positive companies, you find further evidence of the types of businesses benefitting most from the metaphorical king tide.
Over the past 12 months, ASX small cap stocks with negative operating cash flow have materially outperformed those that actually have cash flow. This is illustrated below.
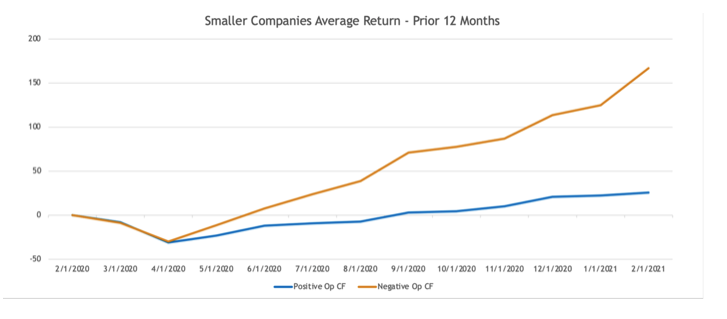 Source: Spheria, Bloomberg Data: Simple Average Return of Stocks Between ($50M and 3.0BN Market Cap Divided Into Positive OP Cash Flow and Negative OP Cash Flow Over Prior 12 Months)
Why Has This Been Occurring?
The liquidity surge and low-rate environment have led to a zero cost of capital and markets today appear to be continuing to assume central banks will leave rates near zero for a long period of time, thus supporting the notion that cash tomorrow is worth more than cash today.
What could go wrong? The answer is the re-emergence of the cost of capital.
A zero cost of capital is unsustainable and in our view, the re-emergence of the cost of capital is already underway. While Central Banks are likely to continue to defend rates for as long as possible, they also appear to have been successful in generating inflation which is incompatible with ultra-low interest rates.
The re-emergence of the cost of capital will turn the tide. The investors swimming naked will be exposed. Those in their togs duly rewarded.
How To Avoid Being Caught Naked
When it comes to small and microcaps, cash today is king. Not aspirational future cash.
The proof is in the data.
When you look beyond the past year and back-test a portfolio of positive operating cash flow vs. negative operating cash flow companies, the result is stark.
Below we zoom out to provide you with a view across the past decade. The blue line (+872%) represents a bundle of all ASX small caps stock with positive operating cash flow. The orange line (+323%) represents the index and the grey line, a portfolio of stocks with negative operating cash flow.
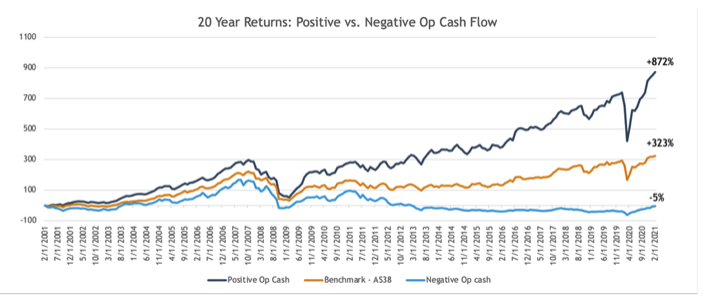 Source: Spheria, Bloomberg Data
We think long term investors in the small and microcap space should always assume an 8% cost of capital and apply a discounted cash flow valuation. As the tide subsides, discount rates are once again becoming relevant.
Small and micro cap companies with strong cash flow conversion rates offer a pillar of portfolio strength in reflationary environments and historically, have strongly outperformed.
As the crowd continues to ignore the warning signs, the opportunities are abundant for investors focused on finding great businesses with strong fundamentals.
Discover more about Spheria’s small and microcap investment opportunities.